ruby -r debug filename.rb
ซึ่ง ruby จะเข้าสู่ mode debug
ข้อเสียของการ debug แบบนี้ ก็อาจจะเป็นเรื่องมุมมองที่จำกัด (การดู source code)
กับความสะดวกในการ set break point
วันนี้ผมก็เลยลองเอา emacs มาช่วย debug
ก่อนอื่น เราต้องมี file ที่ชื่อ rubydb3x.el หรือ rubydb2x ก่อน
เจ้าตัวที่ชื่อ 3x ใช้กับ emacs ที่ version >= 19.3x ขึ้นไป
ปกติใน emacs มันจะมีโปรแกรมสำหรับใช้ในการ debug อยู่แล้ว
เรียกว่า gud , rubydb ก็ extend จาก gud นี่แหล่ะ
ก่อนจะใช้ก็ต้องมีการ load ขึ้นมาก่อน โดยใช้คำสั่ง
M-x load-library rubydb3x.el
M-x rubydb
หลังจากสั่งมันจะ prompt ขึ้นมาถาม
Run rubydb (like this):
กรณีเครื่องผม ผมมี ruby หลายตัว ก็เลยใส่ path เต็มดังนี้
/usr/local/bin/ruby -r debug filename.rb
filename คือ ruby file ที่ต้องการ debug
เมื่อ start ขึ้นมาแล้ว emacs จะเปิด buffer ใหม่ที่ชื่อ
gdb-filename ขึ้นมาพร้อมกับเปิด buffer แสดง ruby file ที่เราระบุ
และ process จะไปหยุดรออยู่ที่บรรทัดที่ 1 ของ ruby file ที่ระบุ
note: แต่ถ้า shell environment variable ของเรามีการ set ค่า
RUBYOPT=rubygems ไว้มันก็จะไปหยุดในโปรแกรม rubygems.rb แทน
จากนั้นเราก็สามารถสั่ง debug command ได้จาก buffer ที่แสดง source code
หรือจาก buffer ของ gdb ก็ได้
keyboard binding ที่มาพร้อม rubydb3x ก็มี
- "\C-b" "Set breakpoint at current line."
- "\C-s" "Step one source line with display."
- "\C-n" "Step one line (skip functions)."
- "\C-r" "Continue with display."
- "\C-f" "Finish executing current function."
- "<" "Up N stack frames (numeric arg)."
- ">" "Down N stack frames (numeric arg)."
- "\C-p" "Evaluate ruby expression at point."
note: คำสั่งข้างบน ต้องมี prefix key นำด้วย
อย่างกรณีเครื่องผม ต้องกด
C-x,C-a นำหน้าก่อนที่นี้ก็มาถึงการ customize rubydb เพิ่ม binding หรือคำสั่งที่ต้องการ
อย่างคำสั่งที่ผมใช้บ่อยๆ ตอนใล่ทำความเข้าใจ source code ก็คือ
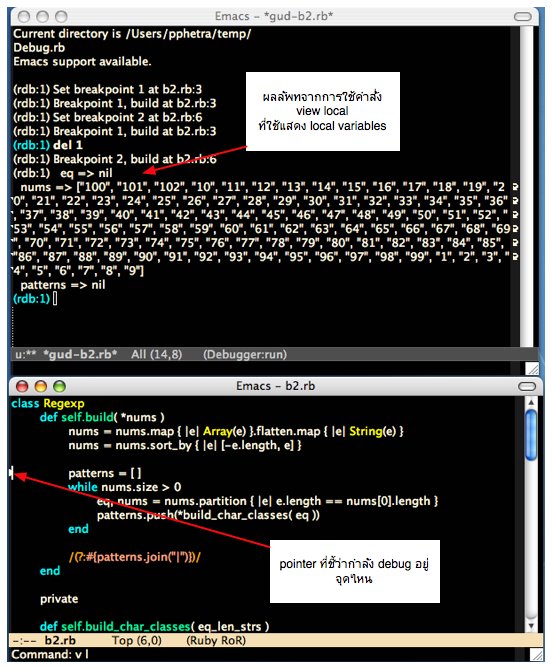
คึำสั่ง v[ar] l[ocal] ที่ใช้แสดง local variables
เราสามารถเพิ่ม binding เข้าไปได้โดยเขียน elisp แบบนี้
(gud-def gud-view-local "v l" "\C-l" "show local variable")
คำสั่ง
gud-def เป็น macro ที่ช่วยในการ define debug commandgud-view-local คือชื่อ command ของเรา (ตั้งชื่อขึ้นมาเอง)
คำสั่งนี้ map เข้ากับ คำสั่ง
v l (command ของ ruby)และ binding เข้ากับ key
(C-x, C-a) C-lมีคำสั่งอยู่หนึ่งคำสั่ง ที่ผมใช้แล้วไม่ work ก็คือ
gud-print ที่ใช้แสดง ruby expression ที่จุดที่ keyboard อยู่ของผมสั่งแล้ว มันได้ expression กลับมาเป็น method ทั้งก้อนที่กำลังทำงานอยู่
ก็เลยต้อง customize ให้มันแสดงตัวแปรที่ cursor ชี้อยู่
โดย gdb เตรียม variable ตัวหนึ่งไว้ให้เราแล้ว
มีชื่อว่า
gud-find-expr-functionโดยปกติมันจะชี้อยู่ที่ function
gud-find-c-expr
;; Code for parsing expressions out of C or Fortran code.  The single entry
;; point is gud-find-expr, which tries to return an lvalue expression from
;; around point.

(defvar gud-find-expr-function 'gud-find-c-expr)
เราสามารถเปลี่ยนไปชี้ custom function ของเราแทนได้
อย่างของผม ผมเปลี่ยนเป็นการ select inner most expr แทน
(defun gud-custom-find-expr()
  (interactive)
  (save-excursion
    (let ((pos (gud-innermost-expr)))
      (buffer-substring-no-properties (first pos) (cdr pos)))))

(setq gud-find-expr-function 'gud-custom-find-expr)


No comments:
Post a Comment